PCIe 3.0
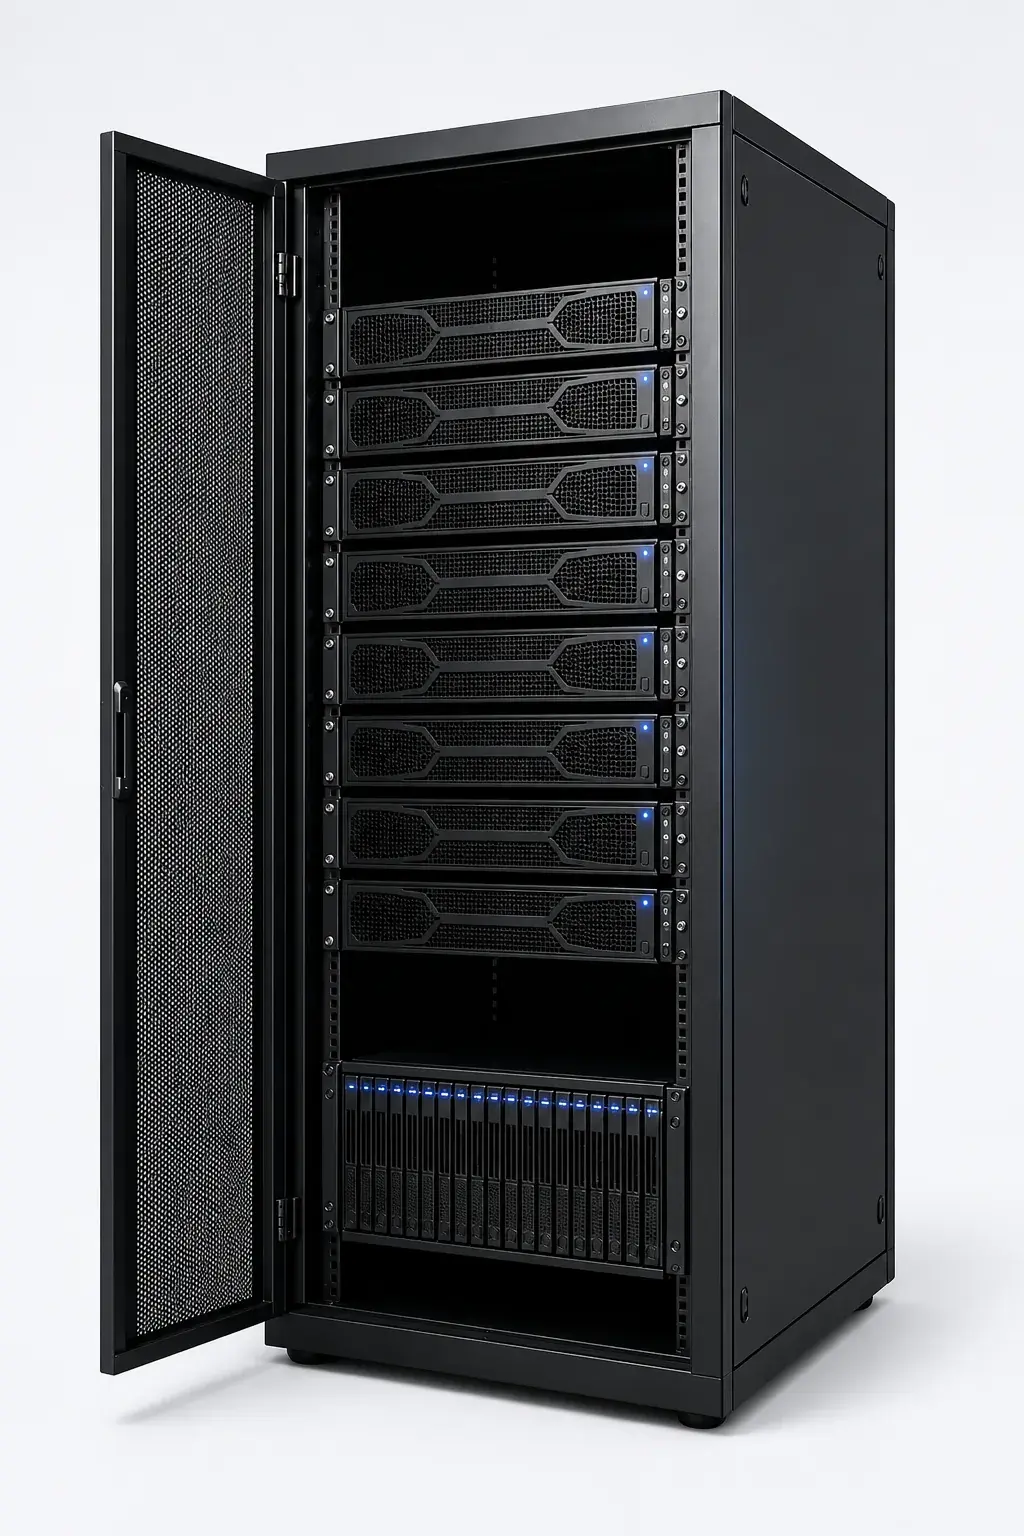
FX100
In production — the platform behind this round of MI308X / 910B signed benchmarks
- 100 Gb per port
- 16M IOPS
- U.2
Reference price ¥371,200
Xinyuanyi
FX series all-flash NVMe-oF. Signed results on a 480B model in production form: throughput +29–40%, time to first token −26–32%. Every headline figure has a downloadable report.
Verbatim queries from our GEO probe, each with a citable answer sourced from the R1–R9 signed reports.
Every metric carries its report ID. Originals are in the Evidence Library. Test code and raw data are reproducible (R8).
View all evidence ›480B production topology, long-context cold-recovery load: +29% at concurrency 8 (lower bound), +40% at the optimal operating point (concurrency 16), +35–36% whole-machine TP4×2.
480B TP8, three concurrency levels: TTFT p50 down from 10.17–35.73 s to 7.53–26.35 s.
Re-compute baseline TTFT p50 149.5 s (conc 16) vs 11.85 s on FX100; throughput 4.1 vs 74.9 tok/s.
Single GPU, concurrency 16, cold read (Qwen2.5-32B): TTFT 37.97 s → 9.30 s; bandwidth 0.98 → 5.23 GB/s (5.3×).
Huawei Atlas 910B platform: DeepSeek-32B serving load 691 s → 112 s (6.2×), DeepSeek-70B 1399 s → 150 s (9.3×).
8-GPU 32B LoRA, 65.6 GB full-model snapshots: 178 s → 94 s; sustained write bandwidth 3.26 → 6.40 GB/s (+96%).
From domestic-GPU enablement to datacenter construction. Five lines, each grounded in measured reports.
Source-level inference-stack adaptation and measured validation across AMD MI308X, Huawei Ascend 910B, MetaX N260 and other platforms — turning domestic / non-NVIDIA accelerators into production capacity.
Learn more ›FX series all-flash NVMe-oF arrays plus a KV-cache tiering software stack: signed benchmarks on a 480B model in production deployment form show throughput +29–40% and TTFT −26–32%.
Learn more ›Complete build-out plans from 128-GPU joint tests to thousand-GPU datacenters: Clos network BOM, three-tier storage with KV tiering, power/PUE, and a fully reproducible Python TCO model.
Learn more ›Efficiency mining for existing clusters: model-switch effective TPS, concurrent loading, checkpoint writes, utilization modeling — improve output first, add GPUs later.
Learn more ›Source-level inference-stack engineering plus developer resources at scale: from upstream patches to fast delivery of new industry needs (video generation, agent platforms, private inference appliances).
Learn more ›FX100, FX200 and FX300 are in production. FX400 general availability is expected in late 2026 (4.8 Tb/s aggregate, 140M IOPS, vendor specification).
Products and pricing ›In production — the platform behind this round of MI308X / 910B signed benchmarks
Reference price ¥371,200
In production — lowest cost per TB of the three shipping tiers
Reference price ¥331,200
In production — PCIe 5.0 performance tier (with 6× DPU)
Reference price ¥924,000
Next-generation flagship — test units 2026-08, GA late 2026
GA pricing to be announced
The full costing model is provided as reproducible Python after NDA — customers can rerun it with their own parameters. Every key figure on this site carries a report ID and is open to third-party verification.
All materials delivered and inspected; each array passes power-on self-test with all 24 drives recognized.
Single-node 8-GPU inference baseline reproduced (R1 basis ±10%); single-array local stress test reaches the 83% line-efficiency anchor.
KV tiering acceleration: TTFT reduction ≥25% and throughput gain within the measured +29–40% band; 8 nodes sharing one array approach the NIC ceiling on read-back.
72-hour continuous stress with no interruption; single-drive / single-link fault injection transparent to the workload; signed joint-test report issued.
The benchmark suite behind the headline numbers is public at github.com/mingxin-tech/mingxin-kvcache-bench. Third parties can reproduce the conclusions.
Naming note: Xinyuanyi FX100 appears in historical test-report filenames as AISSD5000 (also WS5000 / GP5000) — all are names for the same product. This site uses the unified FX naming (FX100/FX200/FX300/FX400); report entries keep original filenames for verification.